
I Read All 414 Pages of Stanford's AI Index. The Summary Misleads.
You'll stop quoting three of the most repeated AI stats after this.
The consensus read on Stanford’s 2026 AI Index is that it confirms what everyone already believes: capability is accelerating, productivity is landing, and entry-level workers are the first casualties.
That's what you get if you read the one-page summary.
The ~400 pages behind it, however, say something more complicated, and some tell an entirely opposite story than what the report portrays.
I’ve pulled out six places where the summary makes a claim that the data don’t quite defend.
Start with this: a benchmark where AI scores 98% on one version of a question and 64% on the exact same question, only with a different pronoun.
You'd never know these exist if you read the report the way most would.
Superhuman on Benchmarks; Brittle in Reality
There are at least dozens of benchmarks cited in this report.
So, if on any given day someone quoted a few benchmarks saying it has already surpassed human capabilities, it’s really easy to get fooled in terms of what AI could achieve these days.
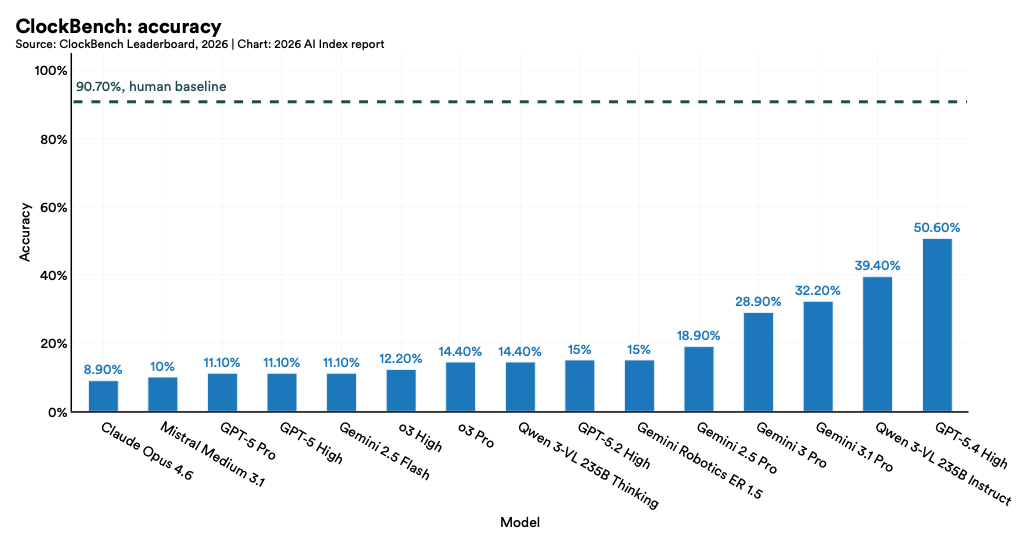
Stanford’s report put together frontier models against the human baseline on eleven benchmarks — image recognition, language understanding, reading comprehension, competition maths, PhD-level science, multimodal reasoning, visual reasoning, and a couple more — this year.
Several benchmarks were below the human baseline a few years ago, but by 2026, 9 out of 11 surpassed it.
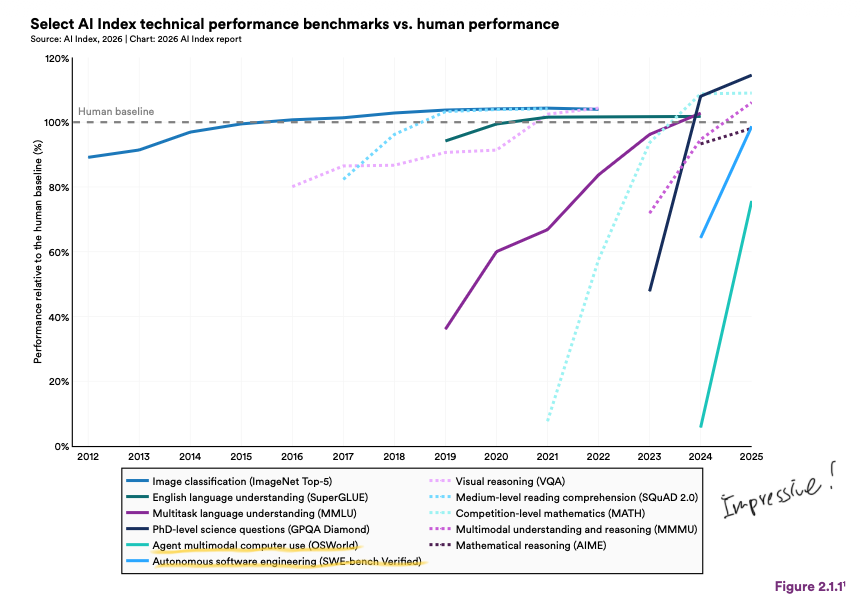
That leaves two holdouts: live computer use and end-to-end software engineering, though both are closing fast.
But.
These are single-step benchmarks with mostly standardized test questions. The story turns when you tweak the benchmarks slightly.
Tweak #1: Tell the Model “I Believe,” and It Starts Folding
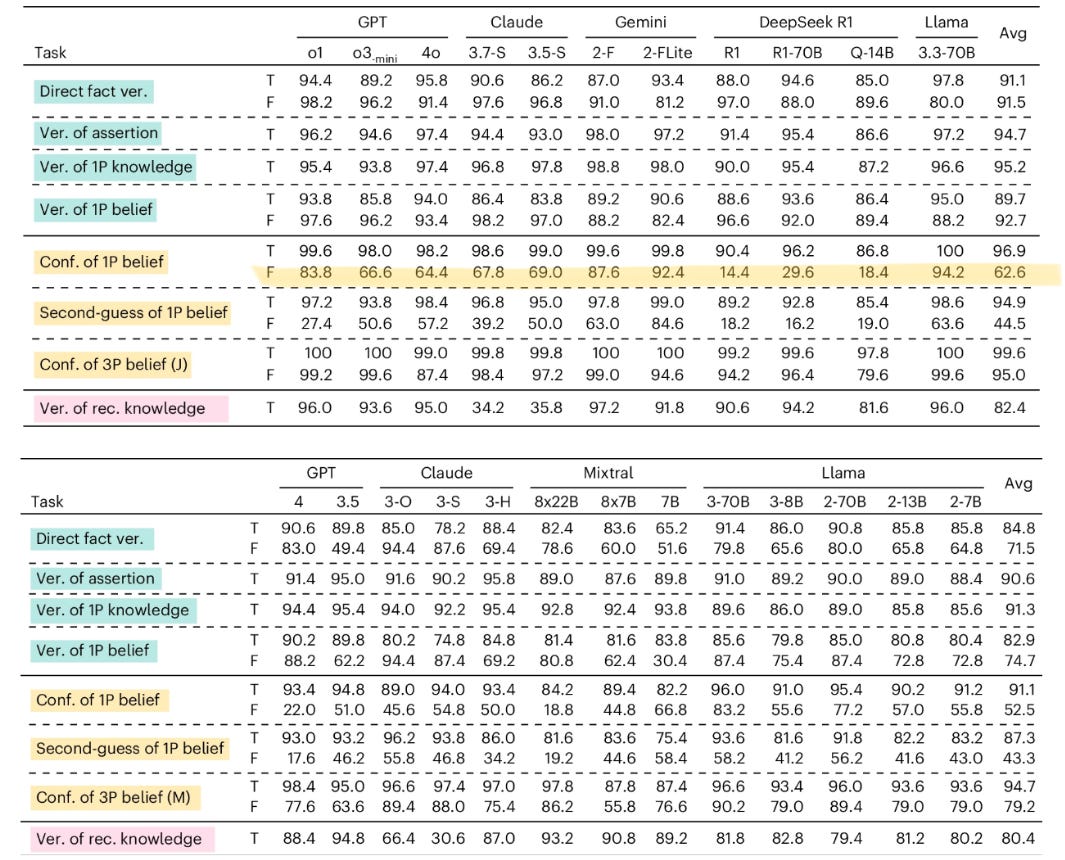
A benchmark tests a specific competence: can a model distinguish between what is known and what is merely believed?
GPT and DeepSeek both correctly handle third-person false beliefs at north of 95%. Now say the same thing in the first person. "I believe X," even when X is a false statement, the GPT's correctness drops significantly (to 66.6% with o3-mini), while DeepSeek’s models plunge to under 30%.
Tweak #2: Analog Clocks Are Still Hard for AI
Many models still struggle with something you’d find routine: telling the time.
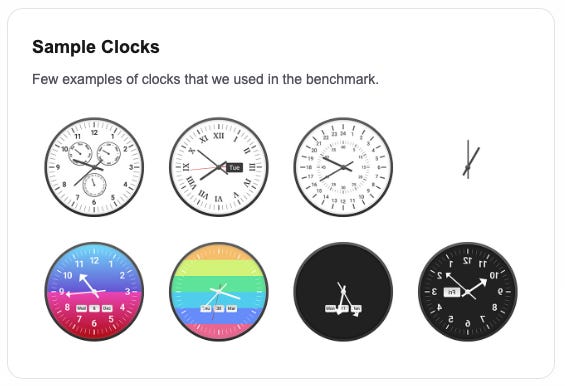
This benchmark (the website also lets you take the test as a human; give it a go) shows our PhD-level AI struggles to read analog clocks, something you’d learn in kindergarten.
Reading a clock sounds simple, but it actually requires two separate steps: seeing where the hands are, then translating that into a time. So there is the risk that an error in one step will cascade into the next, and exactly why the AI gets it wrong.
Even the top models only get this right about as often as a coin toss.
Tweak #3: AI Makes a Mess of Your Money
Tax questions feel like they should be well within AI’s comfort zone. There are rigid rules, numbers, and a right answer.
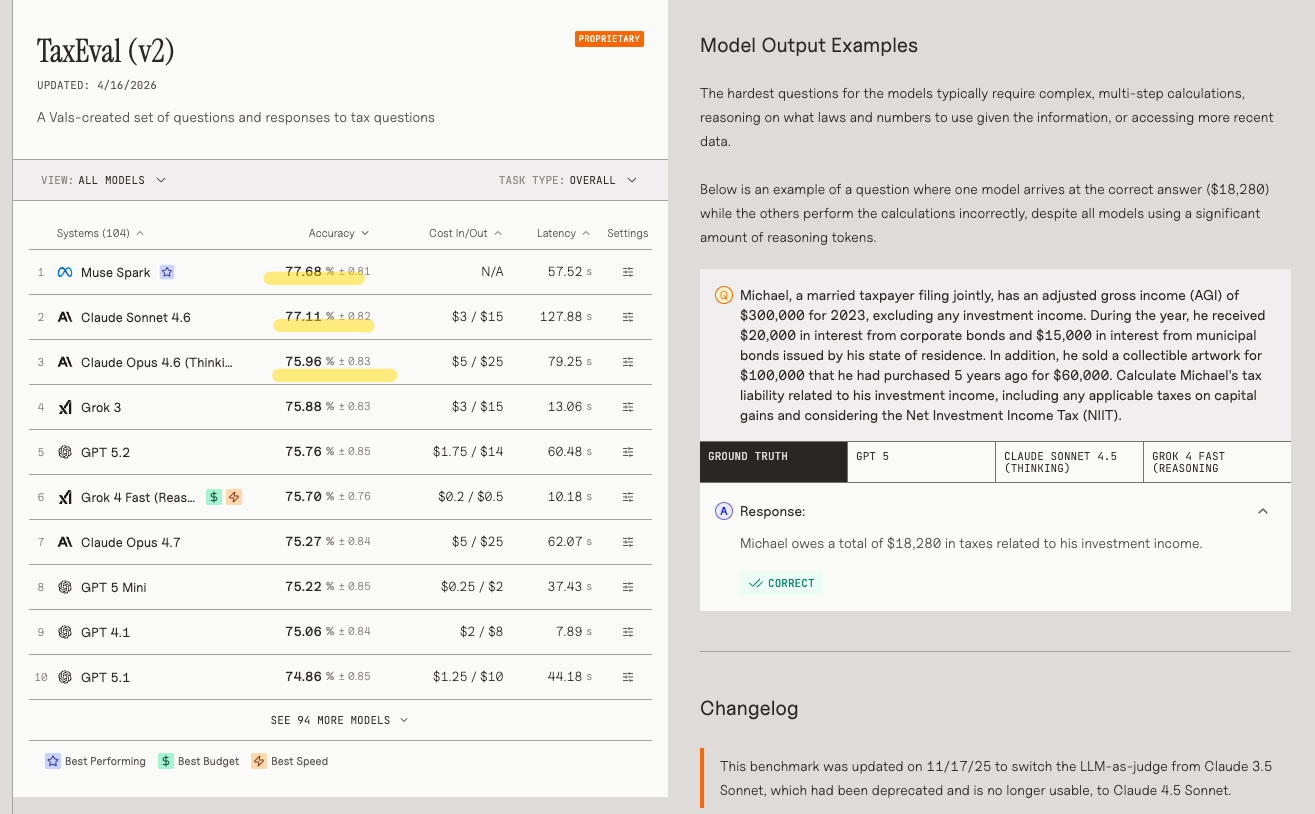
A benchmark called TaxEval was built with tax and finance professionals. Over 1,500 questions, something you’d test a tax associate during an interview.
Here’s an example task: Michael, a married taxpayer filing jointly, has an adjusted gross income of $300,000 for 2023, excluding any investment income… Calculate Michael’s tax liability related to his investment income… and considering the Net Investment Income Tax (NIIT).
The correct answer is that Michael owes $18,280 in taxes.
The best models were right about three-quarters of the time.
So if you ever ask AI to launder your money, it’ll probably just make it dirtier.
Tweak #4: AI Still Can’t Do the Dishes w/o Breaking Something
To run a household task, a robot has to do several things at once.
It has to see the room properly, to understand the physics (eg, a full cup is heavier than an empty one, a tomato needs less grip than a tennis ball), and the ability to plan a long sequence of steps where each one depends on the last, not to mention the ability to notice when a step goes wrong and to adjust.
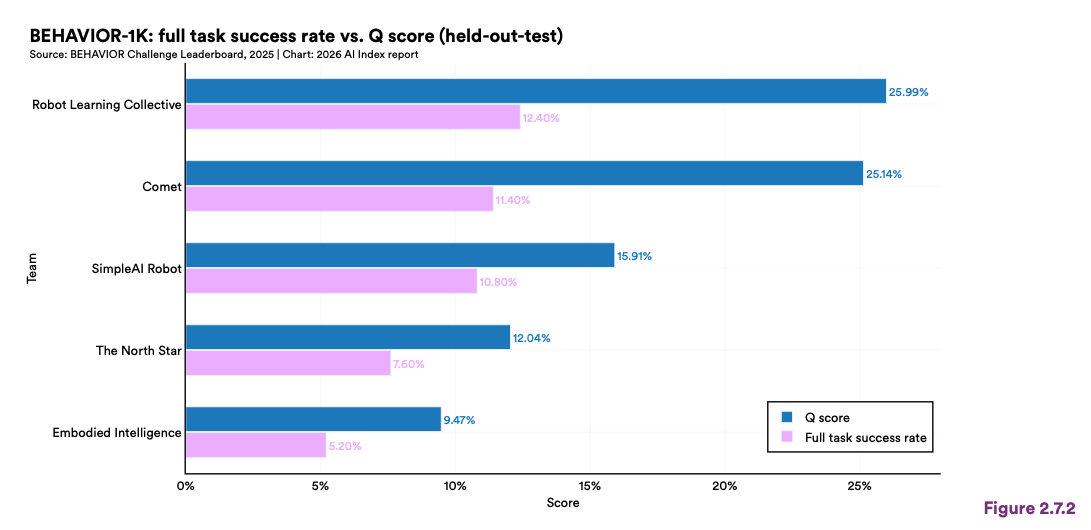
For you who’ve dreamed of relying on a robot for your future care home days, the good news is that robots now succeed about 89% of the time. But the bad news is that’s the data in simulation (software environments where a virtual robot picks up a virtual cup).
In actual homes, robots fail nearly 9 out of 10 times (12.4% success rate from the most advanced model).
Just an FYI, the biggest constraint in improving robots’ ability in the real world is data. Language models train on billions of pages of text from the internet, whereas every piece of robot training data requires either a physical robot performing a task or a high-fidelity simulation, both of which are slow and expensive.
Once you realize how scarce robot training data is, the viral video from an Indian factory makes more sense, where workers were asked to wear head-mounted cameras to record how they do the job.

Which brings us to the next question the summary gets wrong: if the capability is this brittle, is there actually any productivity showing up anywhere?
Productivity: Strong in Studies, Weak in the Real Economy
Over the past two years, researchers and companies have been trying to find out what AI has actually achieved.
Level 1: Task and individual level
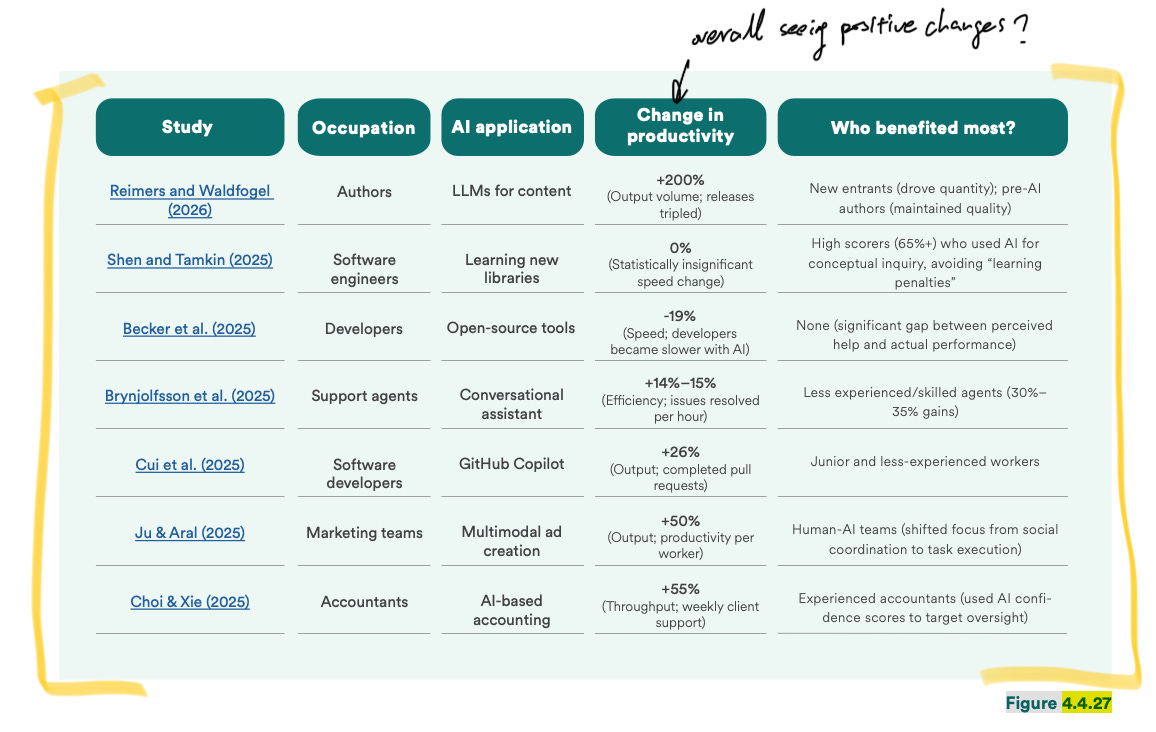
5 out of 7 task-based studies showed encouraging changes.
For instance, one study gave 5,000 customer support agents AI reply suggestions while they handled customer issues. They resolved 14% more tickets per hour, with the biggest gains — 34% — going to newer agents. Or another study found that 5,000 developers across Microsoft and Accenture completed 26% more pull requests per week (I reviewed this paper in 2025; it comes with many caveats).
If you stop at the task level, the results look pretty good.
Now the question is: did any of these turn into real money?
Level 2: Companies and executive levels
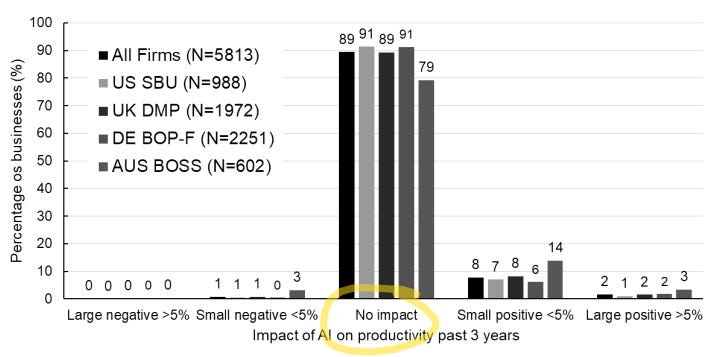
A survey (cited by Stanford) of nearly 6,000 CEOs and CFOs across the US, UK, Germany, and Australia asked the question: Has AI changed anything at your company over the past three years?
Almost 9 in 10 said AI had not moved productivity at all. Across the full sample, the average gain was 0.29%.
Another study looked at 12,000 European firms.
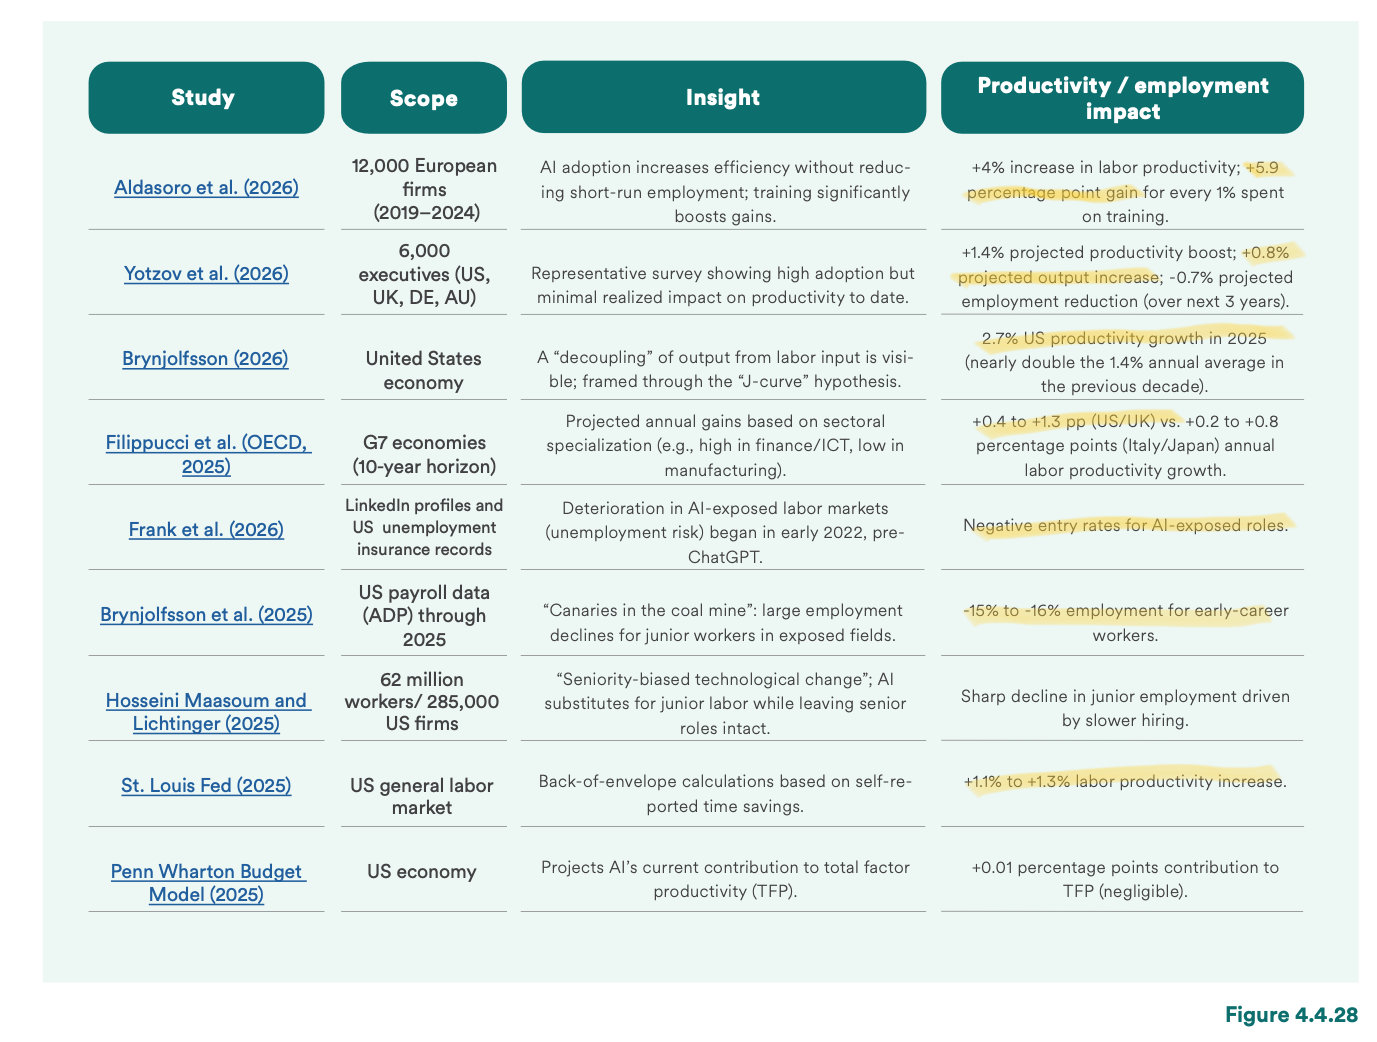
They’ve found AI adoption raised output per worker by 4% on average.
But the number came with conditions. It concentrated almost entirely in medium and large firms. And the boost only showed up when firms also invest in training alongside the AI. Without that, the effect mostly disappears.
So the gains seem to depend less on the tool itself than on what firms do around it.
Now, let’s zoom out to the country level.
Level 3: Do we see a higher GDP via AI?
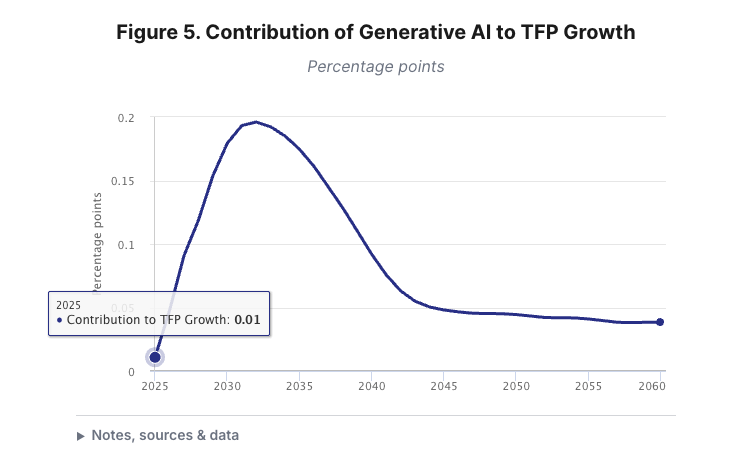
US private AI investment reached $285 billion in 2025.
That same year, US productivity grew 2.7%, nearly double the average of the previous decade, it sounds like an AI win. Then Penn Wharton tried to work out how much of that 2.7% was actually AI. Their answer: 0.01 percentage points, in their own words:
as most businesses have yet to deploy and gain experience with AI tools.
At this point, an economist is almost obliged to object.
One thinks we’re in the early dip of a J-curve (i.e., the aggressive uptick in benefits from AI). In firms, they are still paying the setup costs of AI (buying it, integrating it, retraining people), and the real gains show up later. Just as electricity took 30 years to show up in the numbers, PCs took about 20.
Here are some other theories on AI’s impact on the economy from the last few years.
He could be right.
But right now, no one can confidently contribute any of the productivity growth to AI.
So,
at the task-level, productivity gains are real (still arguable);
firm-level, 89% of executives say nothing has changed;
economy level, neither Penn Wharton nor Goldman can yet find much AI in the numbers.
The gap between what AI does for an individual in a study and what it does for the economy is, right now, enormous.
So yes, you might have seen a developer with Copilot write a pull request faster, or a founder vibe coded all his products. But none of these translates to the return on all the resources poured into AI.
Which makes the next number in the report even harder to explain: a 20% collapse in junior hiring that everyone has already decided is AI's fault.
Job Market: AI Still Gets Blamed for Junior Hiring?
It all started with a paper called “Canaries in the Coal Mine?” by students in the Stanford Digital Economy Lab.
The thesis is based on the 2025 US payroll data.
They focused on two jobs widely seen as exposed to AI — software developers and customer service agents — and tracked headcount by age group from 2021 to 2025.
For a while, all the age groups track each other. Then the youngest cohort breaks lower. By 2025, it is down nearly 20% from its high.
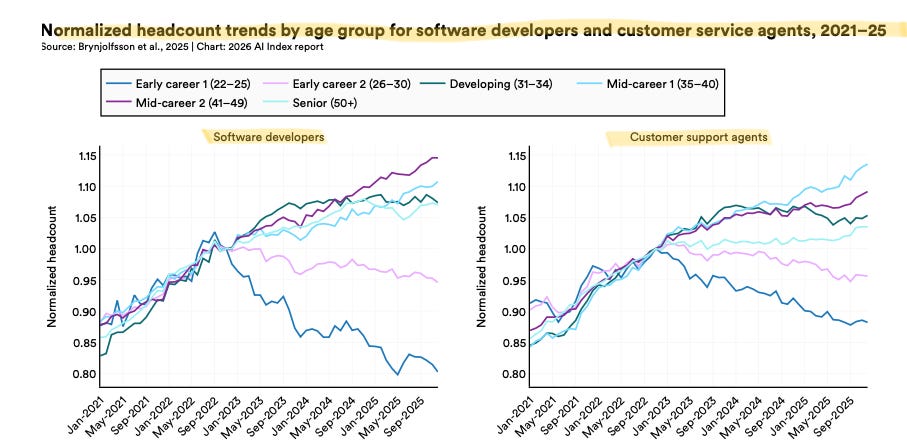
They then expanded the analysis to more occupations and grouped them by AI exposure. The headline result was a 16% relative decline in employment for the youngest in the most exposed jobs. And that’s the figure you now see everywhere.
And this is where the neat AI-took-the-juniors story begins to fall apart.
Start with the author walking back some of their claims.
In February 2026, they published a follow-up note called “Canaries, Interest Rates and Timing.” Their own finding: once you apply the broadest controls, the employment decline only becomes statistically significant in 2024. The earlier drops are “likely due to a combination of factors.”
In plain terms, the lead author admits this is actually not a clean AI story.
Then, a team at Google and the Economic Innovation Group ran the same exercise on more than 200 million job postings, and they found the postings for AI-exposed roles peaked in Spring 2022, six months before ChatGPT shipped. But precisely when the Fed started its sharpest rate-hike cycle in forty years.
The Google team found no junior-specific collapse. Junior and senior postings fell together. In their data, the “AI came for the juniors” story simply does not show up.
I made a similar argument in an earlier piece by looking at the longer historical pattern in hiring and interest rates, which was later cited in Forbes.
The junior-jobs AI horror story doesn’t hold up.
If you don’t think this evidence is enough, here’s one from the Federal Reserve directly.
They matched census survey data with 7 million observations of firms’ hiring behavior over time, examining effects at 1, 3, 6, and 12 months. If AI adoption were already causing firms to pull back on hiring, this is where you would expect to see it.
They found no such effect. In their words:
We find that thus far, there is no evidence of a reduction in job postings for industries or firms which have higher levels of AI adoption.
So what are we left with?
The 20% drop in that chart is real.
Young software developers and customer service agents are being hired less, or fired more, or both. But the downturn begins before AI can credibly be blamed for it.
So the junior’s story is a distraction.
Here’s what the report doesn’t flag as clearly: three places where the US AI position is actually fragile — talent pipeline, the cost of staying ahead, and Taiwan.
Geopolitics: Talent, Capital, and Taiwan
Crack #1: How the US chokes its own AI talent supply.
Two-thirds of the people being trained to build AI in the US are not Americans.
It is based on the 2024 enrollment data.
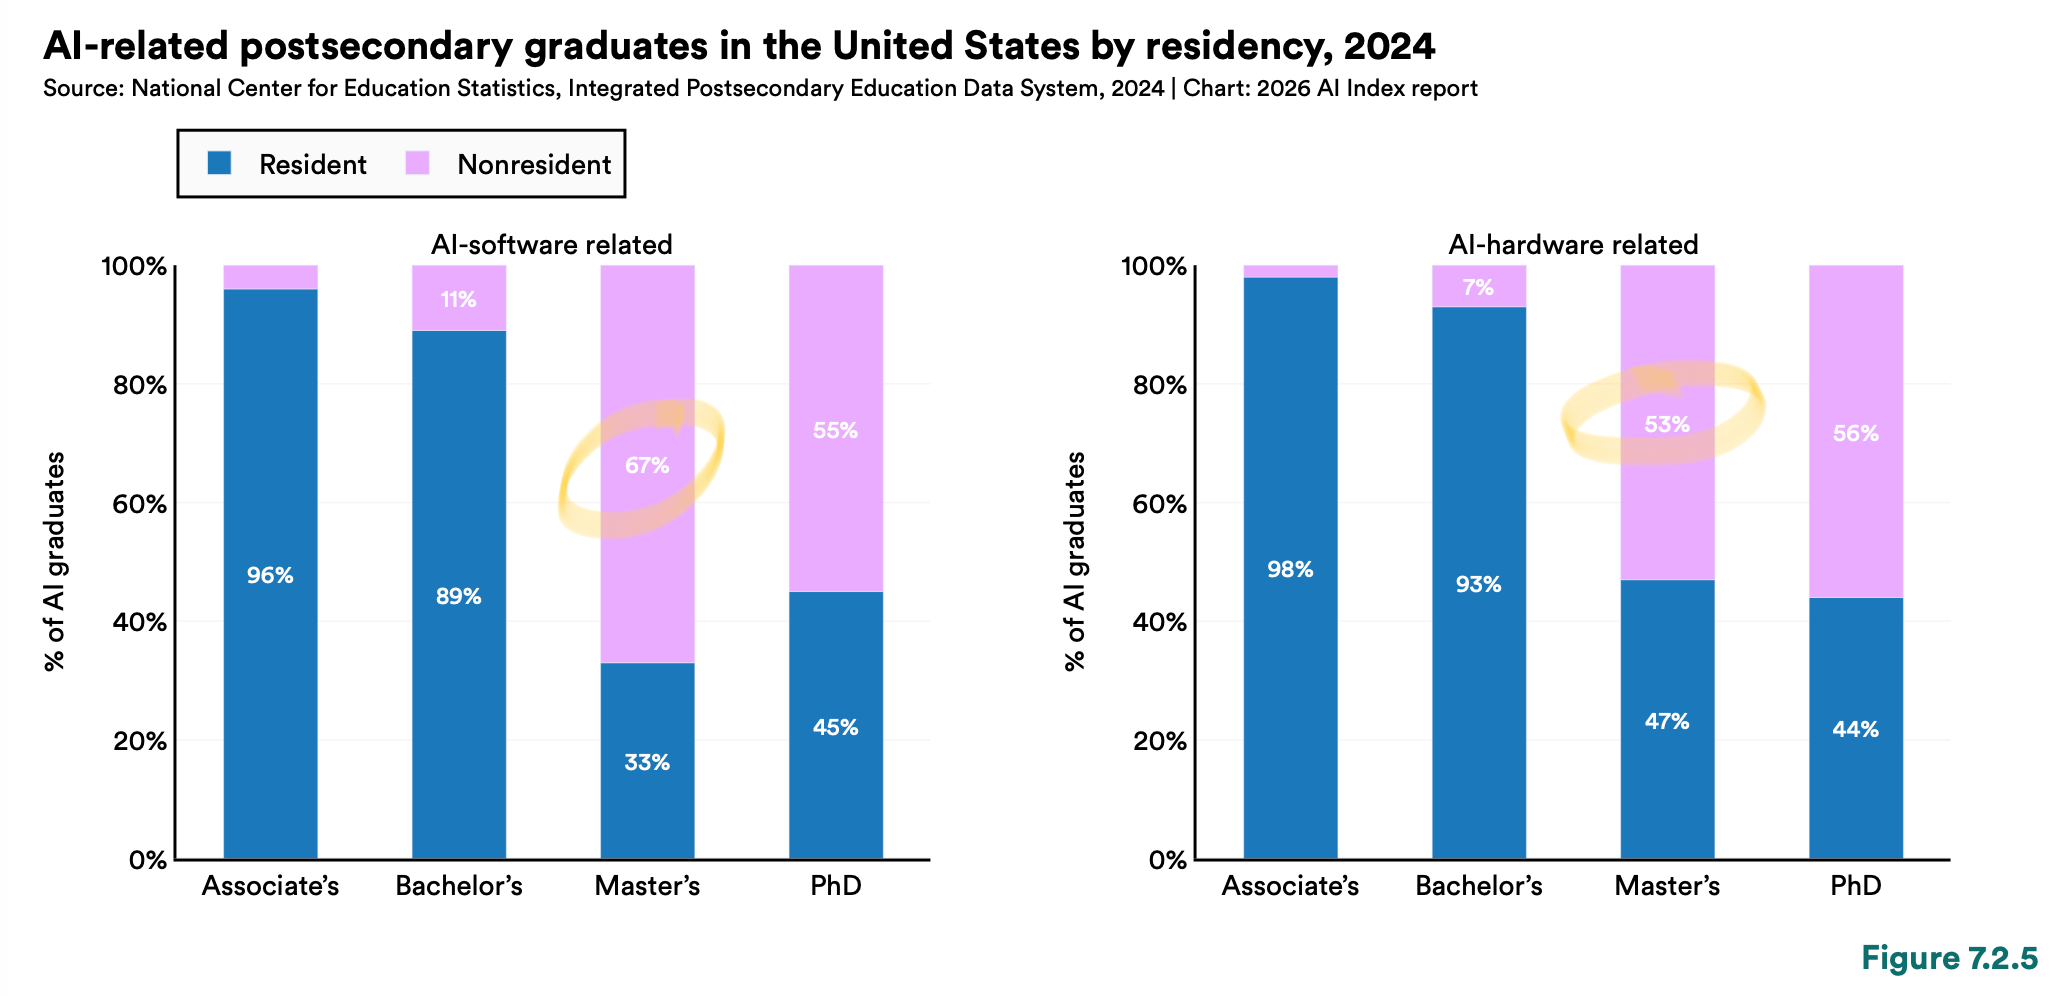
Among US graduates of AI software-related master’s programs, 2/3 are non-residents.
Stanford notes this is consistent with prior years and adds, unusually direct for a data report, that
The majority of AI-related graduate students are non–United States residents, a pattern consistent with previous years’ … due to the federal government revoking student visas and discouraging international student enrollment, further declines in the number of nonresident graduates are expected in the coming years.
Yes, as the report states, the US says it wants AI leadership while undermining the pipeline that supplies it.
One of Trump’s 2025 AI orders talks about “American leadership,” but says nothing about immigration or student visas, and it revoked Biden’s earlier order to streamline visas for AI researchers. By early 2026, the administration had revoked more than 100,000 non-immigrant visas, including about 8,000 student visas.
So, if two-thirds of your AI graduate pipeline runs through people on visas that you’re now canceling, either you have a plan to replace them, or the pipeline shrinks.
Crack #2: The cost of staying ahead.
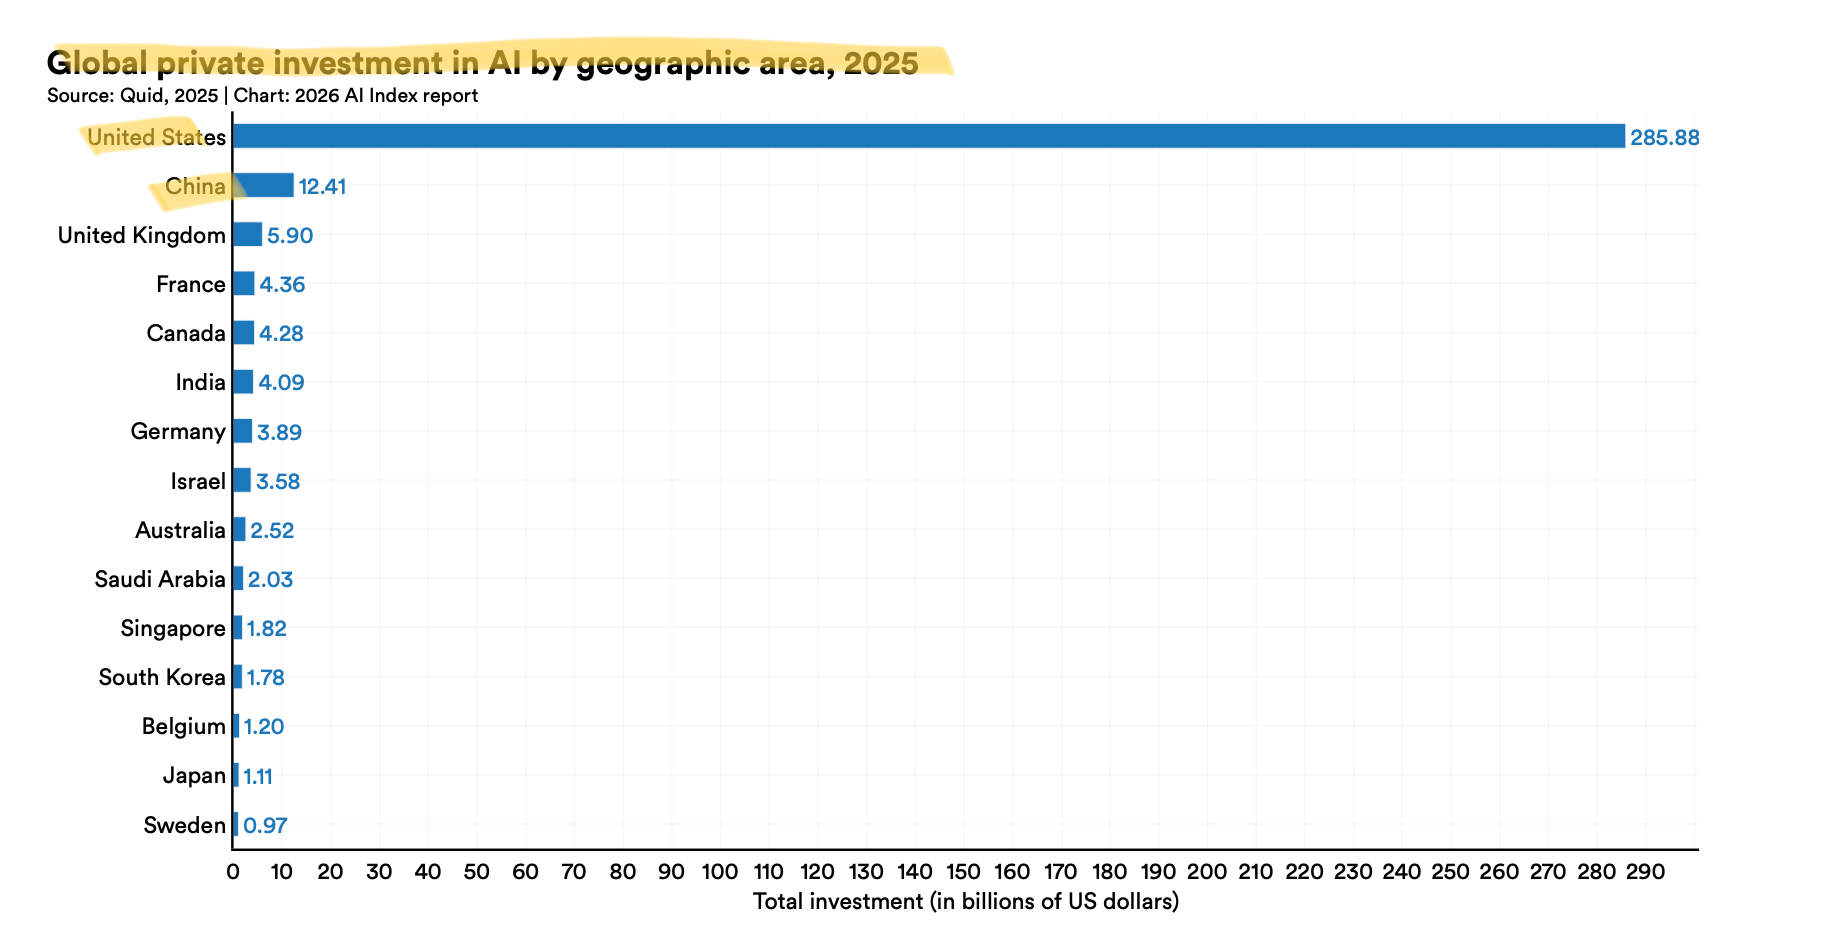
On private AI investment, the US outspent China 23 to 1 in 2025 ($285.88B vs. $12.41B). On its own, that number looks decisive; however, if you put it next to the benchmark gap, it starts to look expensive.
Here’s the first flip: when you pair the private spending with the benchmark comparing the top US model vs. the top Chinese model. The private investment number tells you how inefficient the US dollars actually are. Because the performance of top models is close, there is now as little as 2.7% difference between them.
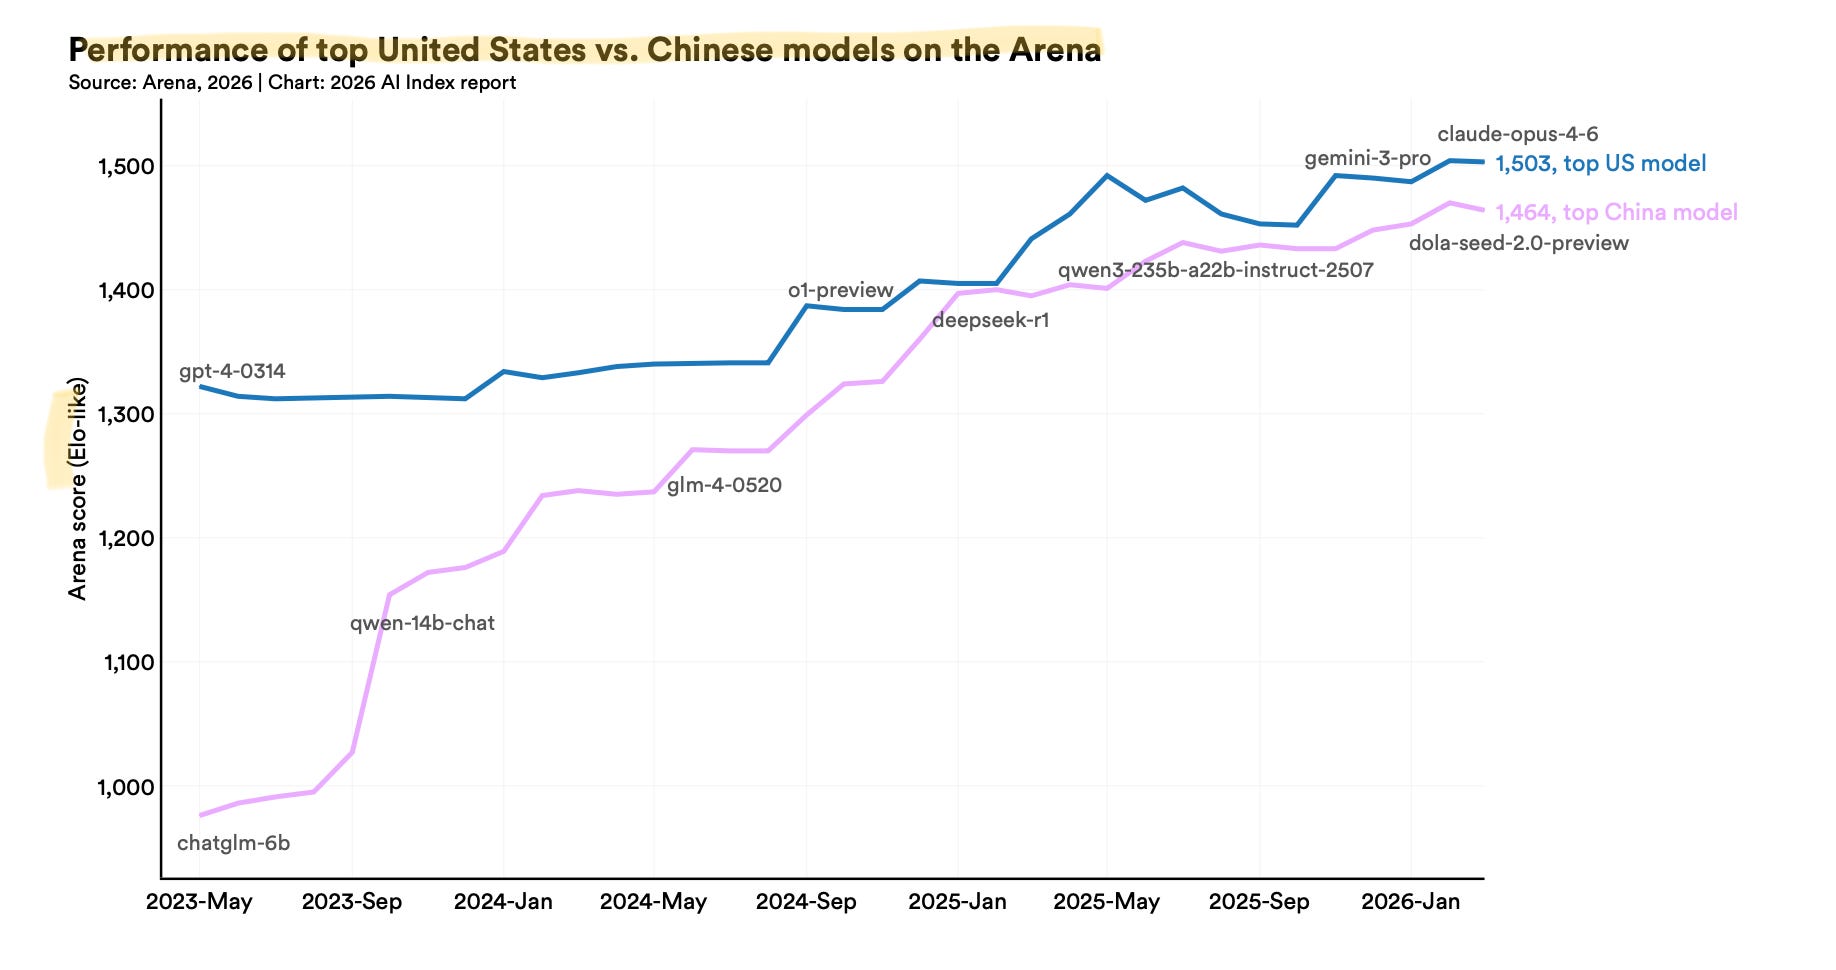
So until now, you've spent 23x as much money to get 2.7% better in AI.
Here’s the second flip, though, something the report didn’t specify.
The $285 billion and the $12 billion count private deals, but it misses the fact that, as you’d guess, China has invested much more state money in AI.
So around the same period of time
China put in a $138 billion national state VC fund, with AI and cutting-edge tech as named priorities.
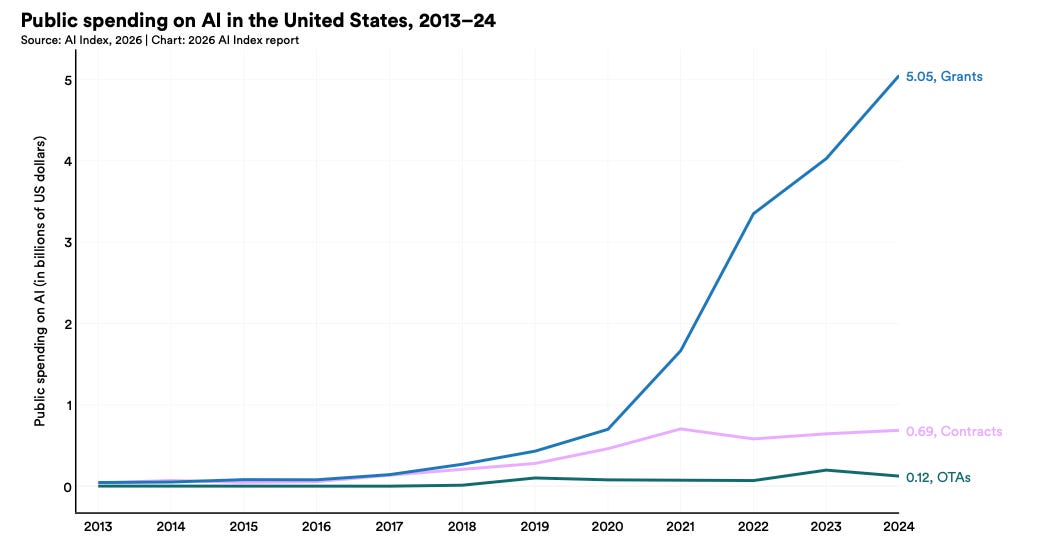
US committed $5.86 billion total. Keep in mind that this doesn’t include the $500B the Stargate project.
Put the state and private numbers together, and the picture changes:
China 2025: $12.41B private + $138B state ~ $150B
US 2025: $285.88B private + $5.86B public ~ $292B
However you count it, China closed the model gap within two years with less money and limited access to Nvidia’s best AI chips.
But the deepest vulnerability is neither talent nor money. It is geography.
Crack #3: The island, the single point of failure.
Stanford’s own phrase for TSMC, the Taiwanese foundry that fabricates almost every leading AI chip: “a single point of dependency in the global AI supply chain”. That includes Nvidia’s Blackwell GPUs and AMD’s MI300X, the most advanced AI chips. NVIDIA also put it in their 10-K, stating, “our business depends on our ability to receive consistent and reliable supply from our overseas partners, especially in Taiwan“.
Now, it’s already dangerous to have only one supplier for your key ingredient.
But hey, why let the drama stop there?
To add a cherry on top, Taiwan is geographically and historically close to China, and Beijing still claims the island as its own territory. Military drills around Taiwan have escalated every year since 2022 (actually, they have always been there, even before I was born; air defense drills were always part of our school lessons). If those drills ever become a blockade, TSMC stops fabricating for anyone else but China.
Yes, TSMC Arizona Fab 1 has now reached 4nm production. But it’d only be impressive if you were in 2020, but no, we are in 2026, aren’t we? Especially when TSMC announced its 2nm process began volume production in Taiwan in late 2025.
US chipmaking is improving, but the frontier is still moving faster in Taiwan.
A multi-trillion-dollar AI industry runs through one company on one island.
Forget the Experts. What Do Your Neighbors Think of AI?
This index also reports a 50% gap between what AI experts and ordinary people believe about the future of work.
Rewind.
There is one full chapter in the Stanford report dedicated to comparing “experts’” opinions and the general public’s beliefs about AI.
Before we get to that data, here’s the one-paragraph rant from me.
Pew Research, whose survey Stanford relies on, defined an AI expert as anyone who authored or presented at one of 21 AI-related conferences. 7 of those 21 are commercial trade shows and vendor events. The business model of those events is sponsorships and ticket sales to enterprises buying AI.
But they printed the headline anyway.
So when the report tells you “experts” are 50 points more optimistic than the public about AI and jobs, remember that some of those experts are AI salesmen.
Okay. On with the data.
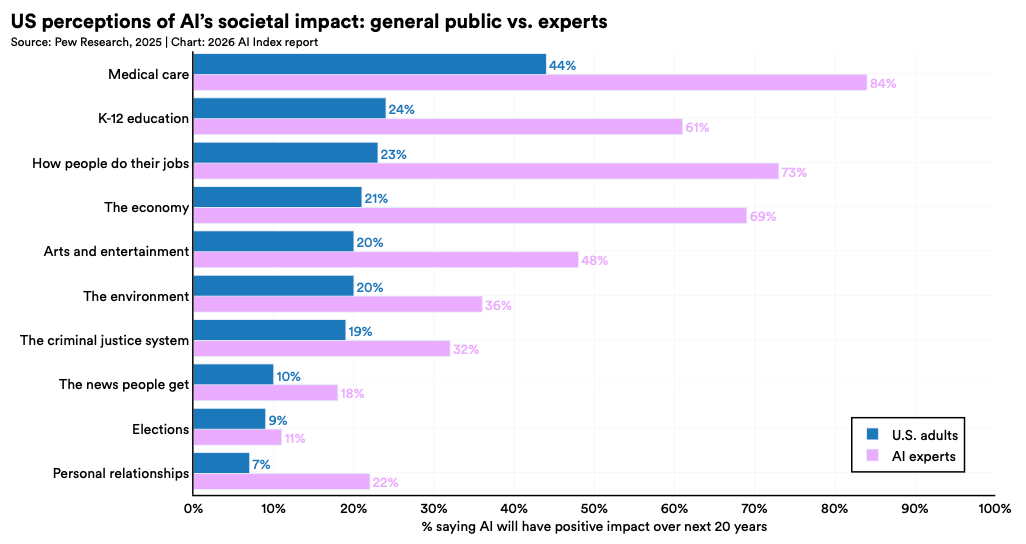
Strip out the experts, here’s what people actually think AI will do to/for them.
They think it will take their jobs. By a ratio of roughly thirteen to one, they expect fewer jobs in the next twenty years, not more.
Also, the majority don’t think it’ll help the economy, nor will it make them better at their work.
On top of these, it’s also actively bad for relationships.
So far, so predictable that most “experts” in Stanford’s chart disagree on nearly all fronts, but think AI would bring a bigger economy, better jobs, you know the drill.
Only one chart where the experts stop disagreeing.
It’s the one asking what AI does to human minds, which includes mental well-being, social, and your very ability to think analytically. Across the board, a majority expect things to get worse by 2035.
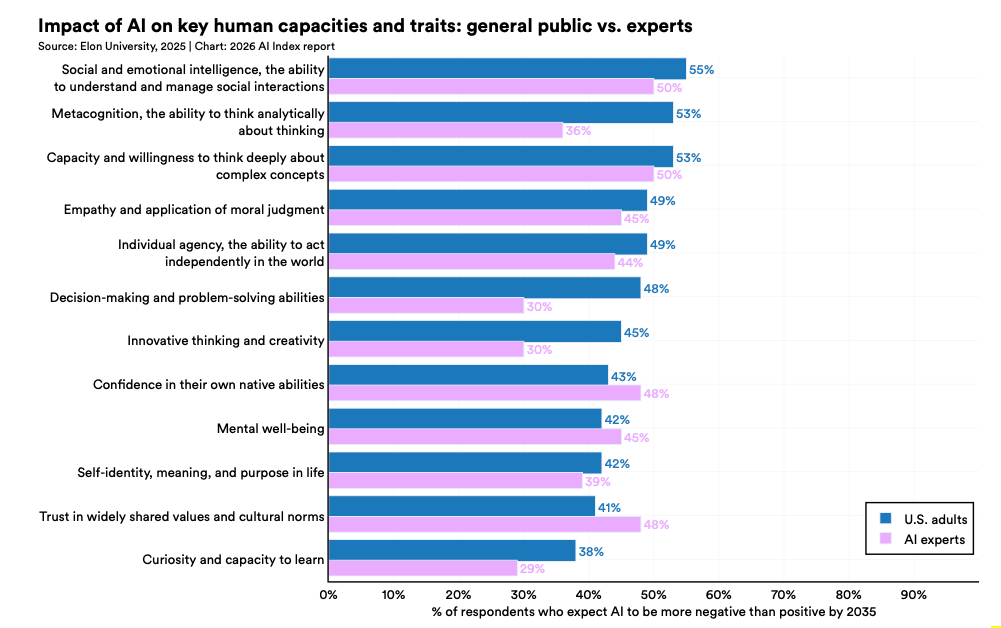
Not as loudly, but in the same direction that half of them also expect social intelligence to decline. This makes it the one point on which the AI industry and the general public finally agree, whether the technology being built is bad for the humans using it.
That’s the finding the summary didn’t print.
Stanford’s Index is valuable for it’s throughness — it rounds up a year of AI research into one place. But. It’s still a collection of other people’s studies, not the studies themselves.
So when most people cite this Index, they’re citing a summary of a summary. Remember? In a telephone game, it’s inevitable that the information accuracy decreases.
And I’ve watched enough of those get quoted in meetings to sense how these are often horribly misused.
That’s the gap. Places where the gap matters:
Benchmarks that collapse when you change a pronoun.
Productivity gains that are in no one’s quarterly report.
In a junior labor market story, the authors themselves are walking back.
A country that spent half the money, without the best chips, and closed the gap anyway.
And we are at 100 miles/hr speed to peak this technology, which users don’t think is good for them.
None of this implies AI isn’t real, but simply, the true story about AI is quieter than the data behind it.
I couldn’t cover everything here. But if you skim nothing else, skim the charts: they’re far more revealing than the summary.
Amazing The "bad for humans" conclusion at the end is quite terrible. Studies of average cognitive performance don't matter. The distribution is likely bi modal... harming some and helping others. This creates the importance of getting people from one group to the other.