2nd Order Thinkers
2nd Order Thinkers.
Explain The McKinsey 2025 AI Report
0:00
-16:11

Explain The McKinsey 2025 AI Report

Spending More On AI Makes You Twice As Likely To Fail (McKinsey's Own Data)

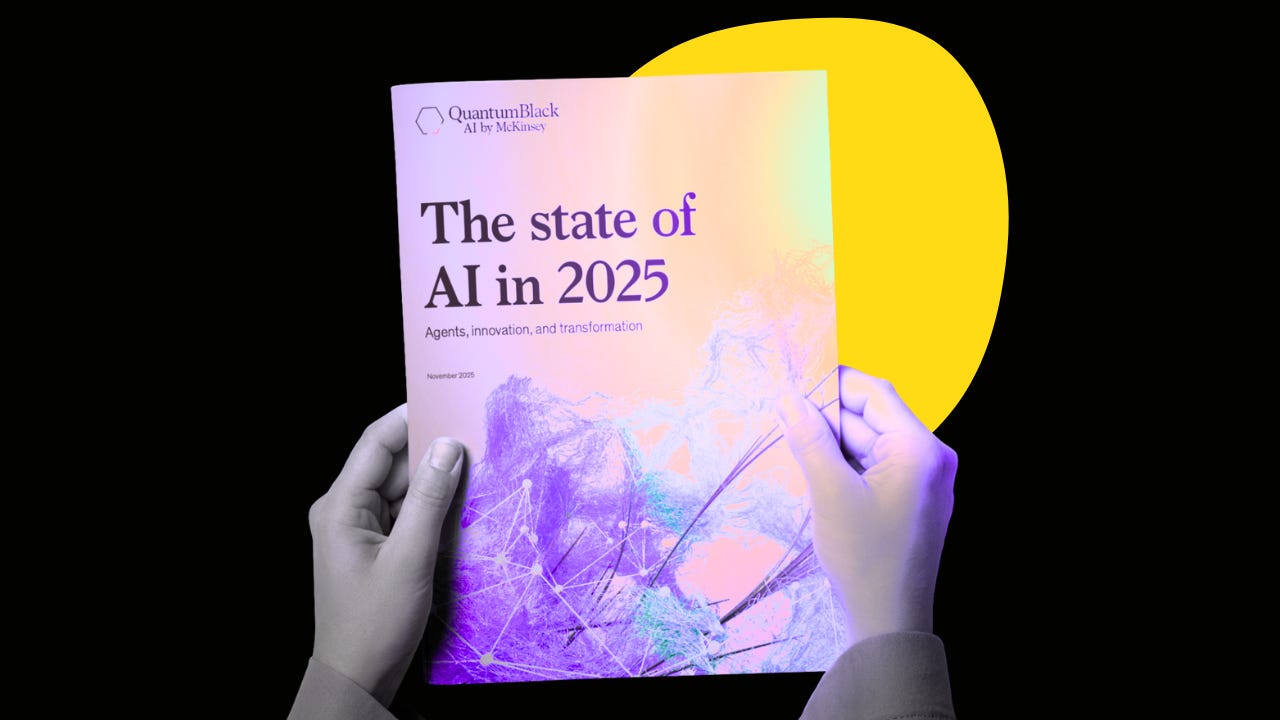
McKinsey surveyed 1,993 companies about AI. Only 109 made the cut as “high performers”, 6% of all respondents who actually pull 5% or more of their earnings from it.

That means almost everyone else in that crowd doesn’t see a return worth mentioning. They’ve got a strategy, they’ve spent on integration, and they probably ticked all the adoption boxes, whereas nothing to show for it in profit.

This aligns with what MIT found: 95% of AI adoption initiatives fail to deliver expected returns.

So it’s not an illogical picture for McKinsey to paint by building its narrative around this 5% of winners, what they do differently, their best practices, their transformation strategies, and more.

What matters is this: you’re not here for citations. You’re here to read how I scrutinize it. So I’m going to keep coming back to one thing: What about everyone else (the rest of the 95%, ie, the 1884 non-AI high performers)?

TLDR

  • Q1: Which functions deliver both revenue growth AND cost savings?

    Build” functions (engineering, manufacturing) are locked into cost-saving narratives, while “earning” functions (marketing, sales) pocket the revenue wins.

    If you’re not close to the customer, don’t expect your AI adoption to show up under revenue in the quarterly report, at least not without some convincing.

  • Q2: Is the 10% agent adoption ceiling temporary or permanent?

    No business function has broken 10% agent adoption.

    IT leads at 8%, knowledge management at 7%, and manufacturing at 2%. McKinsey frames this as “early days,” but what if agents’ capability is limited and use cases are inherently narrow and function-specific?

    The data might be telling us the ceiling, not the floor.

  • Q3: Do “best practices” lead to success, or do successful practices bias best practices?

    High performers” do 20+ things differently, from workflow redesign, agile delivery, AI roadmaps, talent strategies, and more.

    But they also have vastly more resources, with 35% of high performers investing 20%+ of digital budgets in AI versus 10% (on average) of others.
    They were already enthusiastic about the technology by the time they made the investment decision.
    So are the best practices distilled from them mixed with a hint of survival bias?

  • Q: Do I need to spend 20%+ of my digital budget on AI to see returns?

    McKinsey shows 35 of high performers spend that much, if not more.
    But 76 other companies also invested 20%+ and didn’t make the cut of AI high performers.
    So no, spending didn’t guarantee success.
    What it does tell you: throwing money at AI isn’t a strategy. Given that only 1/3 of the companies throw money at AI ‘success‘ in McKinsey’s term.

Now, allow me to walk you through some interesting (Brit style) observations from the firm.

Shall we?

Someone cited data from this report?! Be a friend, they should see this analysis.

Share

Video version, release (almost) on everything Wednesday.


Are you behind?

The headline says “88% of organizations use AI.

Before you panic and start to think about how your firm is left behind, McKinsey’s definition of “using AI” has progressively softened with every passing year.

  • 2017: “Using AI in a core part of the business or at scale”. High bar. Core operations, strategic importance.

  • 2018-2019: “Embedding at least 1 AI capability in business processes or products”. Lower bar, one capability only.

  • 2020: “Adopted AI in at least 1 function”. Even lower, with one function, and could be experimental.

  • 2025: “Regular use of AI in at least 1 function.” Lowest bar. “Regular use” is vague. It could mean daily, weekly, or monthly. One person in one department using ChatGPT…

Here’s another graph that digs deeper, showing that more functions per company are touching AI over the years.

Regardless of which chart, be cautious when someone on your team presents similar data and cites the x times growth of AI adoption over the last few years. 

Because part of that growth isn’t that organizations buy into AI to help with their business, but McKinsey is lowering the bar. Claiming that all 88% of regular AI usage = 88% of orgs adopt AI is loose.

The truth is likely somewhere in between.

Free stuff is great. But quality analysis requires sanity. Sanity requires groceries…


Where AI Actually Works (And Why)?

Next, they break down the AI impact in two ways in Exhibits 7 and 8.

Exhibit 7 asks:

In the past 12 months, did costs decrease in your business unit because of AI use?

Exhibit 8 asks:

In the past 12 months, did revenue increase in your business unit because of AI use?

Same timeframe. Same question structure. Different outcomes. When you put them side by side, something interesting surfaced.

On the cost-savings list (Exhibit 7), Software Engineering and IT sit right at the top. The undisputed champions of using AI to cut fat, automate drudgery, and tighten budgets— your production units.

Now flip to the revenue-gains list (Exhibit 8). It is now marketing and sales units at the top, whereas the production units are at the bottom.

For a business veteran, you should have guessed the reason. When you strip a company down to basics, the supply chain…

  • You have people who decide what to build – roughly, strategy.

  • And those who build – IT, software engineering, manufacturing, operations.

  • Finally, those who earn – marketing, sales, partnerships, customer-facing teams.

Now look at McKinsey’s Exhibits 7 and 8 through that lens.

It is so much easier for the ‘build’ side of the business to prove cost savings than revenue gains. Even with a team responsible for a customer-facing feature, the revenue gains are still very often indirect and messy to separate from the ‘earning’ units.

Unless you are looking at a deeptech firm that splits revenue by products, e.g., AWS or Nvidia. But that’s not in our discussion today.

I’m talking about a person on the Toyota assembly line pressing the button that installs the windscreen is not the one talking to customers about which car to buy, what colour they want, or how much they’re willing to pay. Their work absolutely affects quality, reliability, and throughput, but they are never going to say, “I personally drove x% revenue growth this quarter.”

On the other side, if you run a marketing or sales unit, it’s much easier to see that AI helps you answer customer questions faster, run better campaigns, personalise outreach, prepare for meetings, or run support through chat systems… You get my point.

Because the metrics you live with every day are already revenue-linked.

So when McKinsey asks:

  • “Did AI reduce costs in your function?” and

  • “Did AI increase revenue in your function?”

It’s only natural that you see the result presented.

However!

That does not mean your production unit cannot be creative and cannot introduce a new revenue stream with AI.

It’s always worth having a chat with the unit—especially since there are ways the production unit is often (if not always) a value creation unit.


The Agent Reality Check

The hype around AI agents has been deafening.

This is one of the charts that might bring you back to earth: no function has exceeded 10% agent adoption.

IT lead at 8%, knowledge management at 7%.

Also, look at the long tail; manufacturing sits at 2%, and most functions hover between 4-6%. Not so much a uniform “transformation.” As you’d probably expect, it’s a selective deployment in specific contexts where agents solve defined problems.

The technology, media, telecommunications, and healthcare sectors show the highest agent use. But even there, we’re talking about pockets of adoption, not enterprise-wide rollouts.

The 10% ceiling on this chart may not be a limitation, but an accurate representation of where agents genuinely add value in 2025.


What Separates Winners From Everyone Else?

McKinsey’s entire ‘AI high performer’ analysis rests on 109 organizations—6% of respondents. They then listed all the correct actions taken by these firms as a path to follow to achieve AI success. 

Before you rush to the conclusion and start learning from the list, you need to understand what that label means and what it obscures.

What “High Performer” Actually Means…

McKinsey’s definition has only one criterion: More than 5% of your organization’s EBIT is attributable to AI

Cross this threshold, you’re a winner (by this report).

This matters because half of this report is built around the comparison; every exhibit from 9 to 15 showing “high performers vs. all others” rests on this binary. Practice, investment pattern, ambition metric… all filtered through this threshold.

For example, high performers are more likely to ask their employees to use AI for transformation.

Or that high performers also care about growth and innovation than just efficiency.

And so on.

Here comes what’s interesting…

You Need To Spend More! (Do You?)

Exhibit 15, the section title “one third of the high performers spend more than 20 percent of their digital”!

How convenient?

Hint, you should spend more, you’ll join the winners in no time. How to spend more?

Well, they told you in the earlier exhibit to use AI for change management whenever you can!!

What, you have no experience in change management?

Don’t worry, McKinsey&Co can do it for you!

Fine, you might think I’m being dramatic. But look, compared with the 35 out of 100 high performers who spent more and succeed, there are also 7% out of 1098 respondents who spent as much!!

That’s 76 respondents.

Which means, if you spent more than 20% of your budget on AI, you are twice as unlikely to be an AI WINNER in McKinsey’s book.

I’m pretty sure this isn’t the conclusion they want people to draw. But this is what you get if you let the number (rather than a beautiful picture) do the talking.

McKinsey doesn’t explore this because the survey design lumps everyone below 5% together, so it’s easier to celebrate the win and tell a cohesive story. AND~ as a consulting firm, they are, of course, not going to tell you

It doesn’t matter how much you spend, you aren’t likely to see short-term EBIT return on AI.


How to Read the Report on Your Own? (or Coach Someone Else)

With that context, let me walk you through what we can actually learn—and what requires scrutiny.

Worth taking mental notes:

  • Where AI creates value: Think about the pattern pre-AI. If marketing always reports revenue gains and engineering always reports cost cuts, it shouldn't be a surprise that AI adoption comes to the same conclusion.

  • The 10% ceiling on agent adoption: Is adoption growing, flat, or shrinking? The direction matters more than the number.

  • The gap between risk and reality: Track what problems actually happen versus what you’re defending against.

Caveats:

  • Any high performer comparison. Comparisons like this can be highly subjective; you always need more detail in order to know what works and what doesn't. Very often, learning from what doesn't work proves more valuable.

  • Separate leadership ambition as cause vs. effect from your AI adoption outcome. High performers say they want transformative change, they spend more, and they do more with AI. But did ambition create success, or did the survival bias make them think they had done all the right things?

Point being… You should take this (and reports like this one) as an interesting temperature check, and no more.

AI use is broadening for sure. The adoption is real, however, constrained.

Don’t chase “high performer” status without understanding the footnotes.

It’d be foolish if you simply thought to copy the “AI High Performance“, while so many questions are left unanswered.

To be honest, this is 100% marketing material to get your email address rather than any serious analyst reports.

You know the drill, especially for long-term leaders:

True insight comes from asking the right question, informed by your years of experience and instinct.

Discussion about this episode

User's avatar

Ready for more?